Instead of removing results like a filter would, flags can be used to highlight results which match a condition.
Adding a flag
Flags are applied to individual fields in your visualization rather than through the filters. You can access flags by clicking on the gear icon next to your field and toggling on "Flag/Hide data" from the popup. You can then select a color for your flag and set a condition for when the flag should appear.
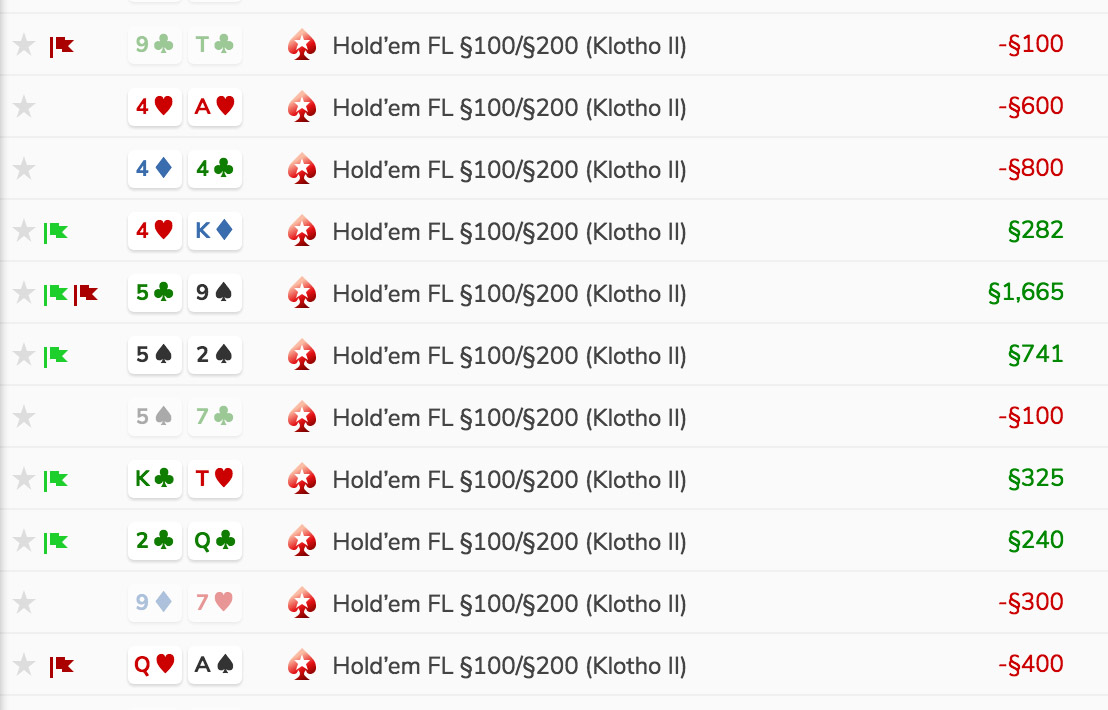
Once you set a condition, the flag will automatically appear. There is no need for Pokeit to re-download the data. In tables, flagged data is indicated with by a small colored flag icon. In graphs, data points matching the condition are highlighted with the chosen color.
Filtering with flags
Flags can actually be used in one of two ways:
- Highlight data which matches a condition
- Hide data which does not match a condition
You can toggle how you want to use flags from the field options popup. Using flags in the “Hide mode” will turn a flag into a filter. In many cases this is just what you’d get if you created a filter, but there are a number of situations where flags are more versatile. Filters only act on the individual hands and tournaments that make up your database, while flags operate on the aggregated data as it's presented in your visualization.
Flags act on the data as it’s presented in the visualization, while filters act on the underlying hands and tournaments in your database.