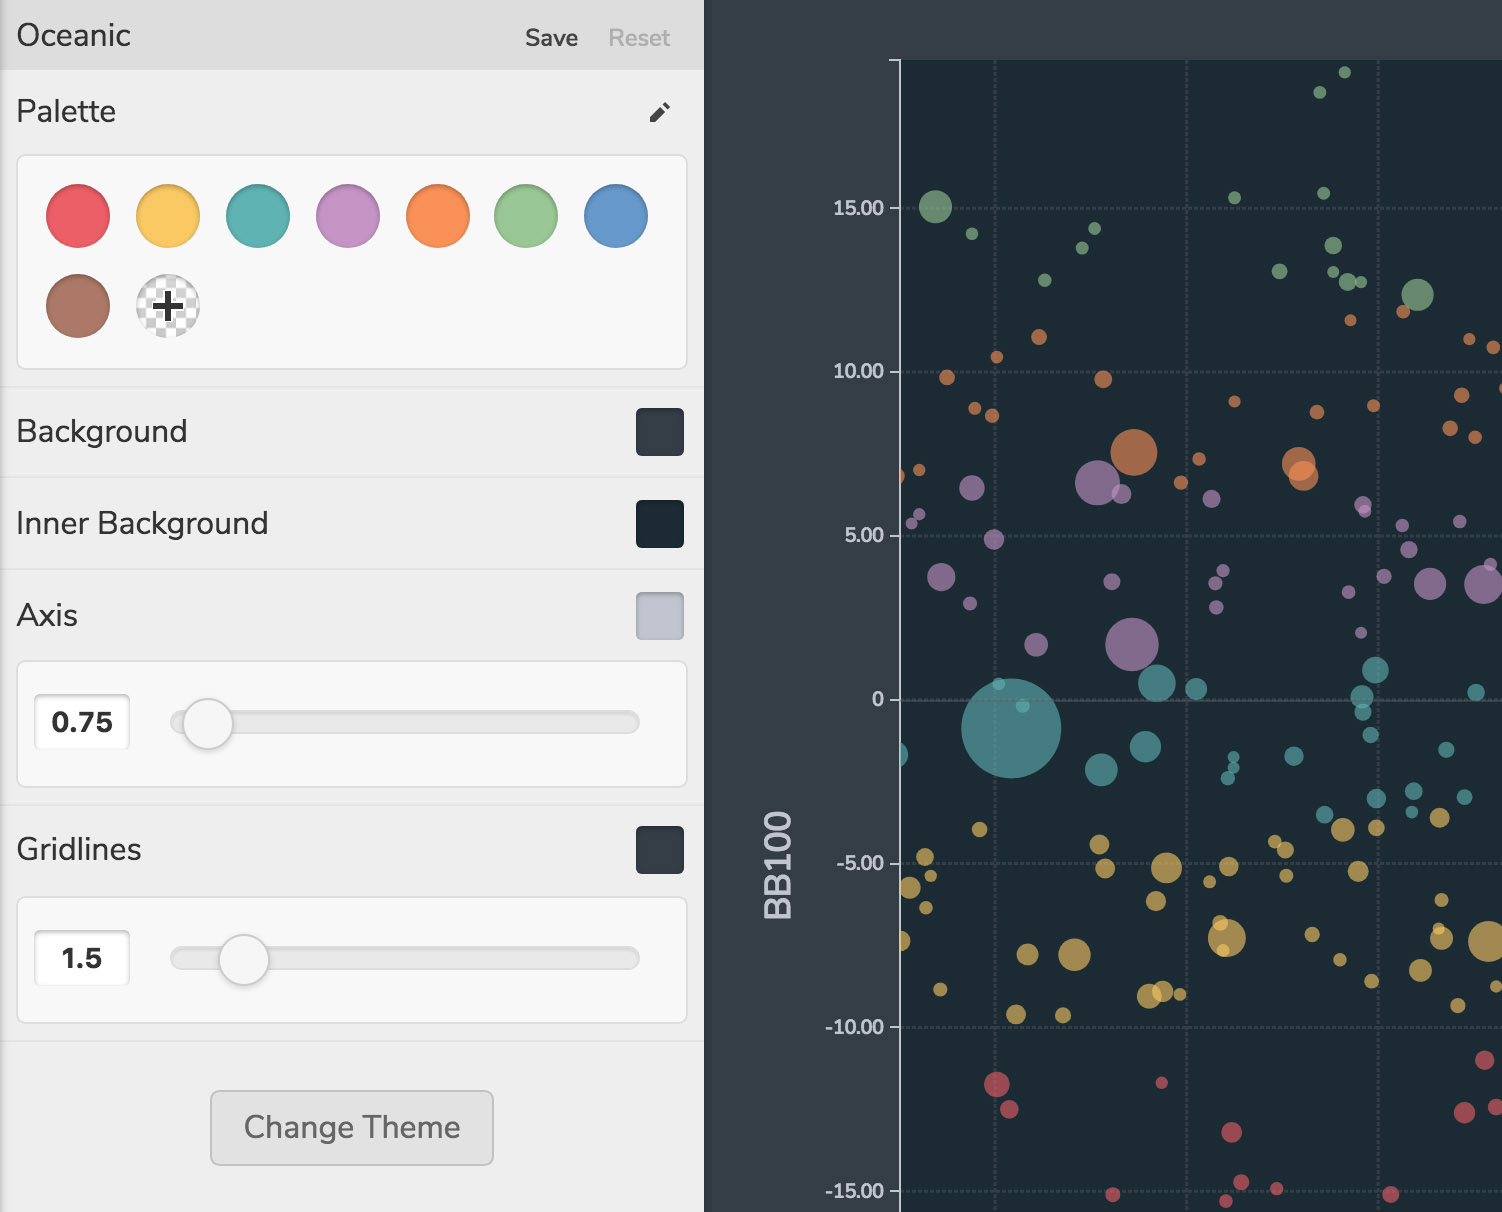
Color and style options can be configured in the theme section. Theme configuration options for graphs are listed below with the corresponding table options in parenthesis.
- Palette: Defines what colors are allowed for the shapes in your graph
- Background / (Header-Footer): The primary background color of your graph or the header-footer colors in table mode
- Inner Background / (Cell): The color of the area within the axes or the cell color in table mode
- Axis / (Text Color): The color of the axes and labels or the text color in table
- Gridlines / (Cell Borders): The color of the grid lines or cell borders in table mode
Themes are savable objects and can be shared between multiple layouts and visualizations. You can access your saved themes from the Asset Manger section by clicking on "Themes".