Visualizations are fully customizable views of your poker data. To build a visualization, you combine a slice of your database with a visual layout and then choose how you want it to be displayed. In this article we examine in detail how to build your own visualizations from the ground up.
What's inside a visualization

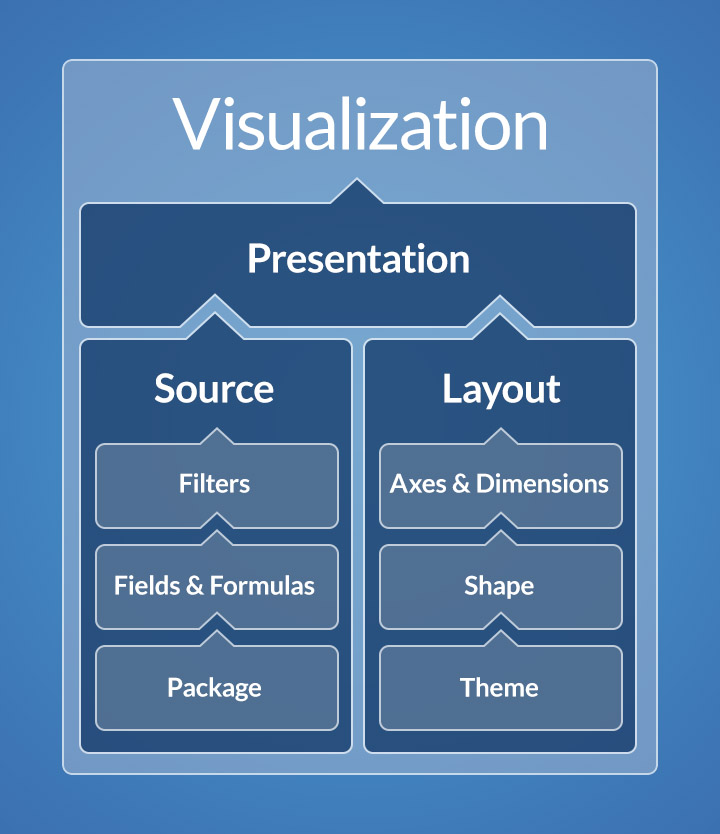
Visualizations are composed of 3 basic components:
| Source | The underlying slice of your database being examined. It can be hands, tournaments, or individual actions within a hand. Pick what fields you get to choose from here as well as how you want to filter it |
| Layout | The table or graph type you want to use in order to view your data. The basic table is the simplest, but there are dozens of potential combinations to choose from including line charts, scatter plots, donut graphs and more |
| Presentation | You can see this for yourself by clicking on the advanced button from the settings panel. There are saveable components within sources and layouts as well. You can build fields and stats using “formulas”, save useful filters for reuse, and design your own custom themes. We’ll examine each one of these later in this section. |
Building a visualization
The source and the layout are both saveable components. You can reuse the same source or layout in different visualizations and create new ones in the Asset Manager. This reusability makes it easy to create new visualizations or alter the view or data of an existing one on the fly.
As soon as you complete your visualization, a green "Update data" button will appear at the bottom of the screen. Click it to load and render your visualization. You can then save the visualization by clicking the "Save" button in the top right of the settings panel.
Altering a visualization
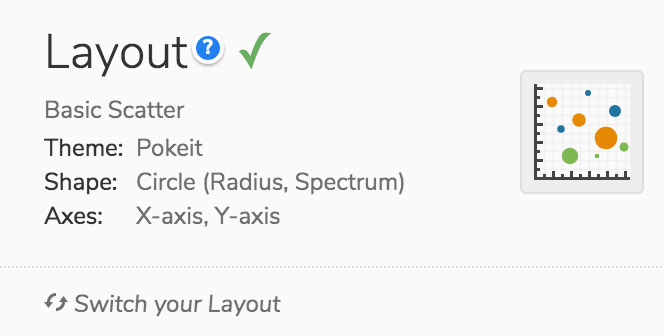
 Once you’ve built a visualization, you can swap out one layout for another by clicking on Switch your Layout. Once you select a different layout from the list, the visualization will update automatically. Pokeit does it’s best to guess how you want to arrange your fields in this new layout but often you’ll want to go back to the presentation section to fix it yourself.

